

Product Suite
VILLAGE PRIORITIZATION
Helps lenders classify villages based on crop acreage, health, yield forecast, and scores of other parameters

IN-SEASON TRACKING
Using remote sensing to track areas and crops of interest, monitoring crop health, making yield estimates and harvest updates

FARMER RISK PROFILE VERIFICATION
Verify crop insurance policies to assess the probability of a moral hazard and manage faster claim settlement

FARMER DECISION SUPPORT SYSTEM
Mobile app that supports farmer enrollment, geo-location, tracking, & advisory

PORTFOLIO ANALYSIS
Assesses crop risk using remote-sensing for standing
crops. Estimate share of the portfolio at NPA risk and likely insurance recovery
Field Management System
Portal for assigning territories to field extension team members and tracking their activities
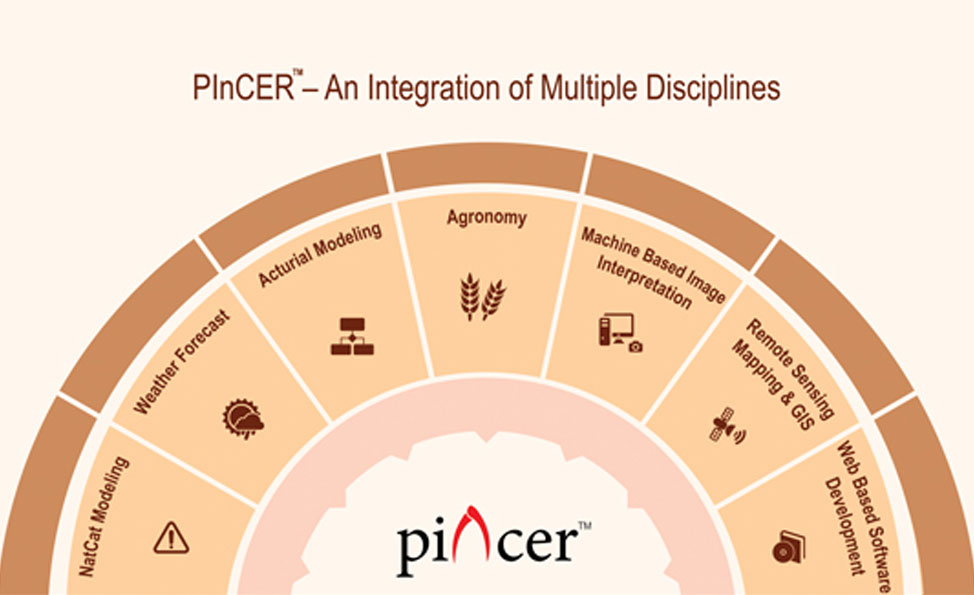
PInCER™ is a powerful amalgamation of advanced actuarial practices, Nat Cat modeling, mobile technologies, image processing and remote sensing techniques backed by long time series data sets and multi disciplinary experts.
Explore What Crop Map Can Do For Your Industry
Frequently Asked Questions
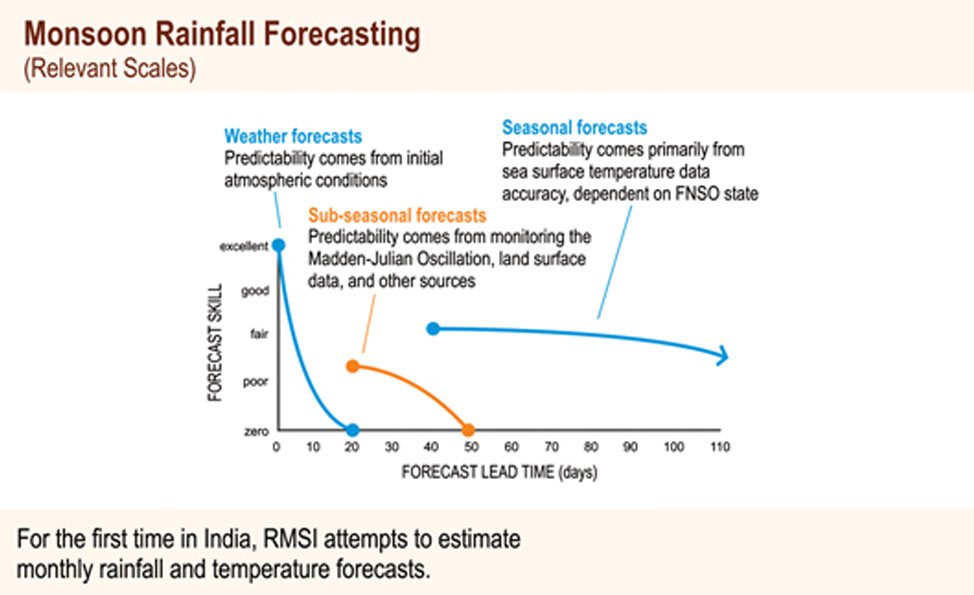
PInCER™ is a first-of-its-kind crop map of India at the village level. PInCER™ Crop Map is the most accurate, granular, and actionable data for India at Village Level, updated every Kharif and Rabi season and covering major crops such as paddy, soybean, maize, sugarcane, and wheat at high resolution.
To ensure the accuracy and integrity of GIS data, a well-crafted quality assurance (QA) is crucial. It includes integrating data conversion and maintenance phases throughout to guarantee success.
Data mapping is a science derived from interpreting images. There is an accuracy band to consider, but the technology is improving each season.
RMSI Cropalytics is a subsidiary of RMSI, a three decades old global geospatial provider with expertise in integrating earth sciences, geospatial, analytics & modeling to solve real-world problems.
So, Cropalytics has the expertise in using advanced technologies like AI-ML, satellite imagery, drones, and IoT combined with advanced modeling and meteorological domain expertise to offer end-to-end analytics solutions.
PInCER™ Crop Map is the most accurate, granular, and actionable data for India at Village Level, updated every Kharif and Rabi season and covering major crops such as paddy, soybean, maize, sugarcane, and wheat at high resolution.
The crop map shows the geolocation of sown acreage of the current cropping season in high resolution. Currently, crop acreages are estimated at a coarse resolution by state or district but not marked or verified on the map.
Our team of experts makes the crop map actionable by overlaying useful data on it, including village boundaries, farm sizes, crop health, weather forecasts, yield estimates, and land ownership. As a result, it allows for more accurate acreage estimation by village and sharper identification of agrarian distress, as well as data-based decision-making on the deployment of resources, risk mitigation, and procurement.
The crop map will be updated every crop season. This allows tracking changes in sowing patterns, shifting between crops, and estimating the extent of early or delayed sowing.
Geolocation of standing crops is essential for any government or private body to provide efficient, targeted services to farmers. Governments can better identify distressed acreages, input companies can better allocate stock and manpower, insurance companies can settle claims faster, and banks can monitor loanee acreages better.
© 2021 RMSI Cropalytics. All Rights Reserved.