India Kharif Cotton Yield: Climate Impacts & State-Wise Trends 2025
By Ritabrata Mitra, Sales Head, RMSI Cropalytics
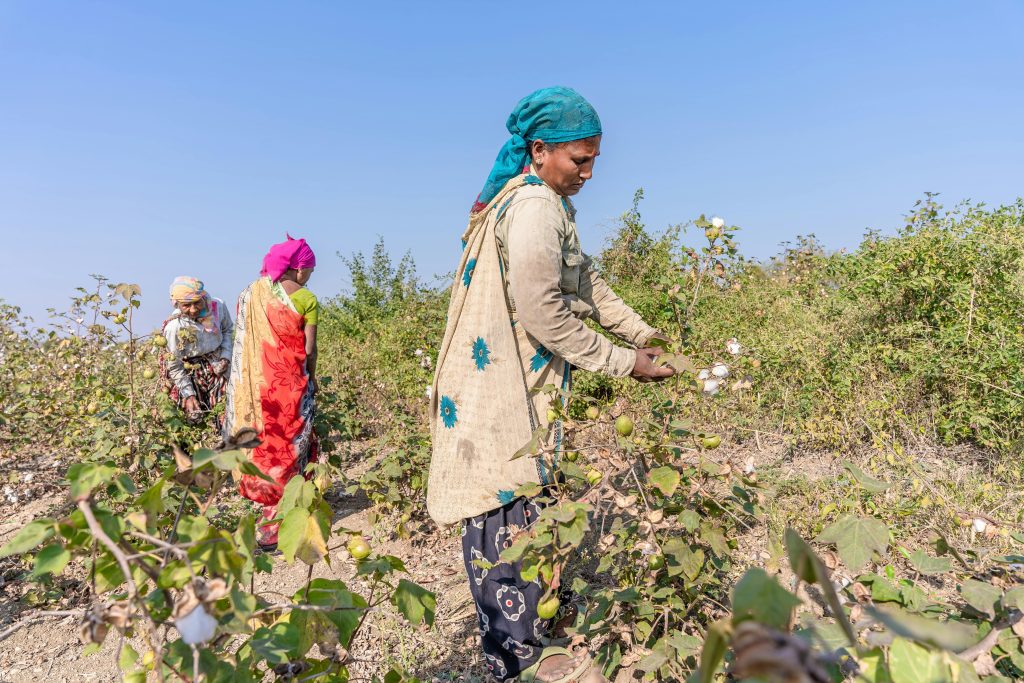
With the onset of the Kharif season, it’s impossible not to talk about the crop that dominates it, cotton. India’s textile industry is predominantly cotton-based, and cotton plays a crucial role in the country’s economy. The sector contributes nearly 2% to the country’s GDP, 10% to industrial production, and 8.21% to overall exports. Globally, India is the sixth-largest exporter of textiles, accounting for a 3.91% share in world textile exports. India is also among the largest producers and exporters of cotton yarn. The textile industry directly employs over 51 million people and indirectly 68 million, making it one of the country’s largest employers.
This year, cotton is once again set for growth. Sowing has shown a healthy rise, covering 31.25 lakh hectares compared to 29.12 lakh hectares last year, a significant increase of 2.14 lakh hectares. The MSP for cotton has also risen from ₹7,121 to ₹7,710. Maharashtra leads in cotton acreage with 40.86 lakh ha, followed by Gujarat (23.66 lakh ha), Telangana (17.70 lakh ha), Karnataka (6.84 lakh ha), and Madhya Pradesh (6.14 lakh ha).
To assess the impact of the Kharif season on cotton production, we use RMSI Cropalytics’ Crop Outlook Model, which highlights the following insights:
Rainfall-Sensitive Cotton Production in Haryana
Despite no flood-related losses, the yield decreased significantly. This indicates that droughts alone wiped out most of the yield, reflecting the lack of buffer irrigation systems and the state’s extreme dependence on rainfall.
The Unique Case of Punjab and Rajasthan
Both states recorded very low flood and drought losses. Yet, their yields fell noticeably. This suggests that these states may have reached their cotton-producing potential and can only increase yields with advanced technology.
Largest Absolute Loss in Gujarat
Gujarat recorded the highest absolute loss in yield, caused entirely by floods. This makes the state the largest contributor to India’s overall reduction in cotton yield, highlighting the urgent need for hydrological planning.
Special Focus: Meghalaya
Even without flood or drought losses, production in Meghalaya still declined. This points to non-climatic factors such as poor input quality, sowing delays, or pest attacks affecting productivity.
Disproportionate Impact on Tamil Nadu
Tamil Nadu faces the highest flood and drought pressures, yet manages to keep crop losses under control. This reflects the success of effective crop and disaster management practices in the state.
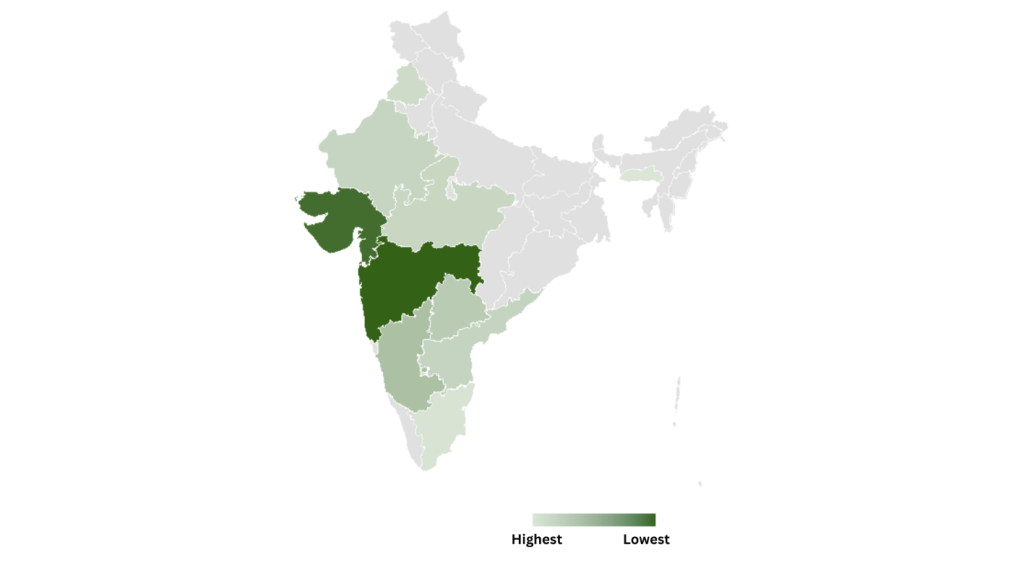
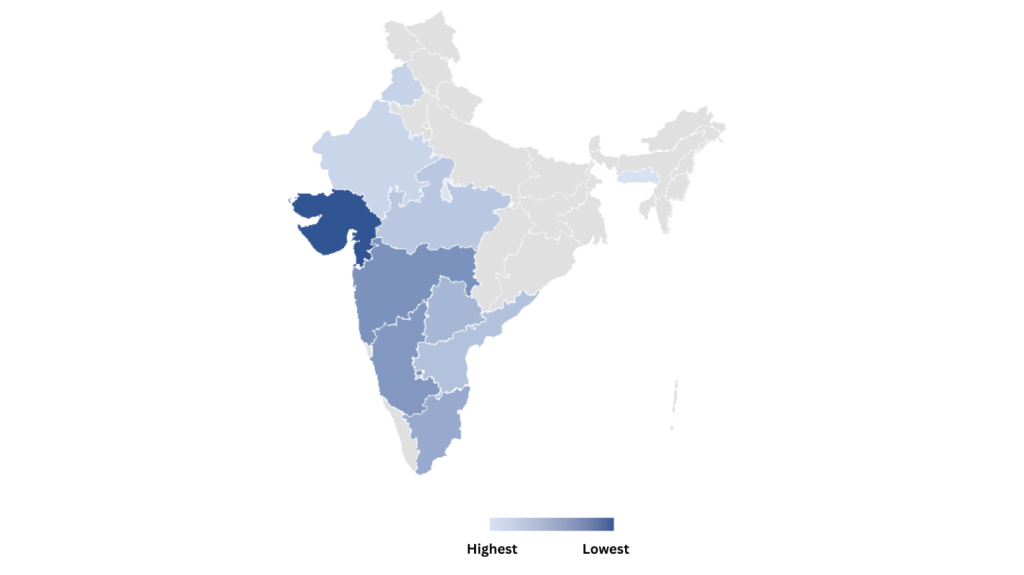
Yield and Production Insights
The green heat map illustrates cotton production in the Kharif season, with Maharashtra leading, closely followed by Gujarat. However, yield results (shown in blue) tell a different story, with Gujarat, Karnataka, Maharashtra, and Kerala recording the highest yields.
Regression analysis established a strong correlation between yield drop and climatic factors like floods and droughts. The model indicates that more than half of the yield variation is explained by these two factors alone, while less than 1% of the variation is random.
Key findings include:
- A unit increase in flood loss has historically caused a 6.16% rise in yield drop.
- A unit increase in drought loss has led to a 17.77% rise in yield drop.
- Droughts affect cotton nearly three times more severely than floods.
- Even without accounting for fertiliser use, pest pressure, or agronomic practices, climatic factors explain over 60% of yield variation.
Conclusion: Climate at the Core of Cotton’s Future
Cotton sits at the intersection of climate and commerce. While sowing and MSP are on the rise this Kharif season, yield outcomes remain highly climate-dependent. Tamil Nadu shows how disaster management can safeguard productivity, while states like Haryana and Gujarat need urgent irrigation and flood-control measures.
For India to sustain its global cotton leadership, expansion must be paired with resilience—blending traditional strengths with data-driven foresight.
You must be logged in to post a comment.